Areas Under the Normal Distribution
| General |
| Areas |
| Symmetric Areas |
| A(-n ≤ z ≤ n) |
How to Use this Applet
The Graph Area
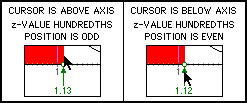
- Drag any highlighted location on the z-axis to move that location along the z-axis. When you drag a location, if the cursor is above the z-axis, the hundredths digit of the z-value will be odd. When you drag a location, if the cursor is below the z-axis, the hundredths digit of the z-value will be even.If you want to know why the applet operates in this non-standard way, see the explanation at the bottom of this page.

- The <LEFT> and <RIGHT> arrow keys can be used to horizontally move the location with indicator arrows.
- The <UP> and <DOWN> arrow keys can be used to switch the indicator arrows from one highlighted location to the other.
- If the arrow keys don't respond, click the cursor in the applet frame then try again.
Other
- Use the DECONSTRUCT button to see how the area is calculated using areas generated from tables [ A( z ≤ n ), -3.49 < n < 3.49, n rounded to the hundredths position ].
The "Even - Odd" Hundredths Digit Feature
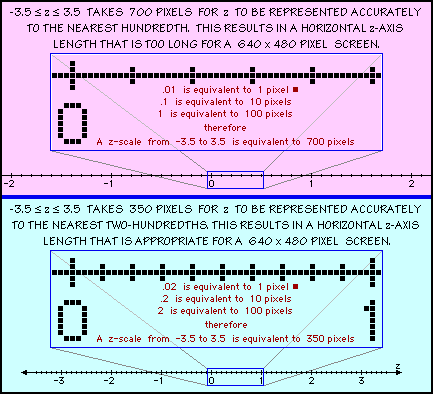
- A one pixel for every 0.01 change in z causes a visual horizontal scale length to be too large for a screen that is 640 pixels wide. As a consequence, a different type of scale must be chosen. If the applet is written using one pixel for every 0.02 change in z, the visual horizontal scale length is acceptable. Doing this creates a problem for the user who must be able to enter values for z rounded to the nearest hundredth. By creating two states for each pixel; one state where the cursor is above the axis and another state where the cursor is below the axis, the user can be provided a smaller horizontal scale length with greater "accuracy" than is actually visually present. See the illustration below.

 |
|