Linear Programming Graph
How to Use this Applet
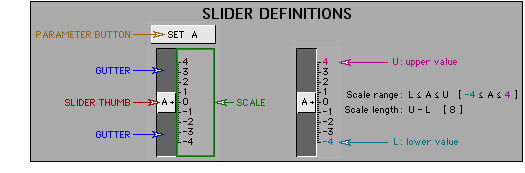
Definitions
- <SHIFT>+drag: Hold down the <SHIFT> key, then drag the described object.
- <CTRL>+drag: Hold down the <CTRL> key, then drag the described object.
- <CTRL>+<SHIFT>drag: Hold down both the <CTRL> key and the <SHIFT> key, then drag the described object.
- ⇒: One of the following relationships:
- less than ( < )
- less than or equal to ( ≤ )
- equal to ( = )
- greater than or equal to ( ≥ )
- greater than ( > )
- A filled dot (
 ) is the intersection of two lines, both with corresponding equations including the equality.
 - An empty dot (
 ) is the intersection of two lines, one or both with corresponding equations not including the equality.
Control and Keyboard Functions
- Use the slider controls to change the following parameters:
- m and b in the linear relation y ⇒ mx + b.
- a, b and c in the the linear relation ax + by ⇒ c.
- n in the linear relation y ⇒ n.
- n in the linear relation x ⇒ n.
- Drag the slider thumb to change the value of a parameter. Use the <UP> and <DOWN> arrow keys to increase or decrease the selected parameter. (Use the keys for fine adjustments.)
- NOTE: If a key doesn't respond:
- position the cursor in the applet frame
- click the mouse button
- try the key again.
- Use the <LEFT> and <RIGHT> arrow keys to change the selected parameter. The selected parameter will have light blue slider gutters.
- Drag a slider scale to change the range of the scale while maintaining the scale length.
- Drag a location in a slider gutter towards or away from the thumb to change both the range of the scale and the scale length.
- Select the corresponding parameter button to enter a value for a parameter.
- Select the MOVE ORIGIN button, then drag in the graph area to move the entire coordinate system.
- Select the CHANGE A SCALE button, then drag in the graph area, towards or away from:
- the x-axis, to change the y-axis scale.
- the y-axis, to change the x-axis scale.
- Select the PRECISION button to set number rounding.
- Select the TRACE button to see if the corresponding cursor location is on the currently selected graph by substituting cursor location coordinates into the currently selected equation.
- Select the RESET button to restore the applet to the initial state.
Graph Area Functions for y ⇒ mx + b
- Drag the dot to move the line.
- Drag a location along the line other than the dot to change the slope of the line.
Graph Area Functions for ax + by ⇒ c
- Adjust the line by changing the parameters. There are no methods available to adjust the graph in the graph area.
Graph Area Functions for y ⇒ n and x ⇒ n
- Drag a location along the line to move the line.
General Graph Area Functions
- <SHIFT>+drag in the graph area to move the entire coordinate system.
- <CTRL>+drag in the graph area, towards or away from:
- the x-axis, to change the y-axis scale.
- the y-axis, to change the x-axis scale.
- <CTRL>+<SHIFT>+move in the graph area to identify if the corresponding cursor location is on the selected graph by substitution of coordinate values into the selected inequality.
Keyboard and Other Functions
- Press a number to make that linear inequality the currently selected one.
- Position the cursor in the graph area then press the "t" key (See the previous TRACE button notes). Pressing a number to make a different linear inequality the currently selected one will display information about the cursor position in plane coordinates relative to the selected inequality. Comparisons can be made between the different inequalities using this feature.