Binomial Distribution
Examples
There are three examples demonstrating the use of the applet.
How to Use this Applet
The Control Area
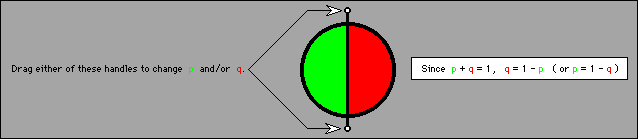
The sliders change the parameters "n" and "N" in a binomial experiment. "n" is the number of trials within an experiment. "N" is the number of times the experiment is performed.
- Drag a slider to change the value of a parameter.
- The <LEFT> and <RIGHT> arrow keys can be used to change the selected parameter [light blue].
- The <UP> and <DOWN> arrow keys can be used to increase or decrease the selected parameter. (Use this feature for fine adjustments.)
- If the arrow keys don't respond, click the cursor in the applet frame then try again.
- Drag a parameter scale to "move" it. (I.e., change the range but maintain the scale "length".)
- Select the corresponding parameter button to enter a value for a parameter.
- Select "ADJUSTABLE SCALES" to change the position or scale of the histogram (See notes below).
- Select "SMALL n SCALES" to display all of the relevant data on the smallest horizontal interval.
- Select "LARGE n SCALES" to display all of the data on an interval containing the endpoints of "zero" and "n".
The Graph Area (when "ADJUSTABLE SCALES" is selected).
- The <SHIFT> key: Click and drag horizontally in the graph area to move the entire coordinate system horizontally.
- The <CTRL> key: Click and drag in the graph area towards or away from the :
- horizontal scale to change the vertical scale about the horizontal axis.
- highest location of the "bell"-curve to change the horizontal scale about the horizontal "center" of the curve.
Other
- Use the "GRAPH LINES" button to graph lines through the highlighted points ( • ).
- Use the "GRAPH SEGMENTS" button to graph line segments with the highlighted points ( • ) as endpoints.
- Use the "RESET" button to restore the applet to the initial state.