A pictograph is a graph consisting of pictures used to visually represent a frequency table.
Below is a frequency table of choices of favorite colour of one hundred students.
A pictograph based on the frequency table is shown below.


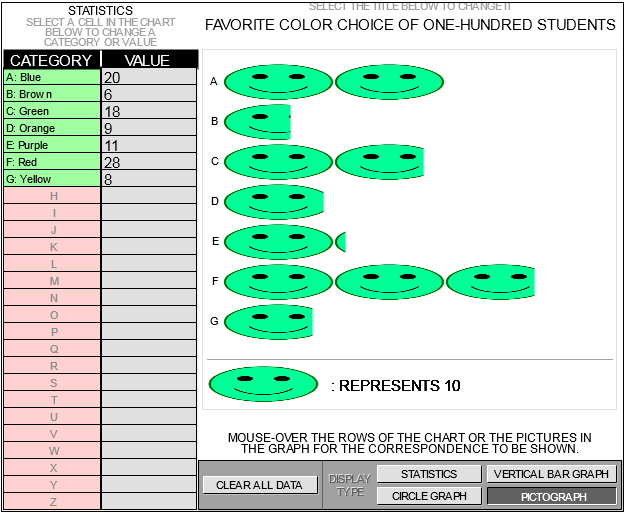 Image onlyInstructions text as in global.js