ShowMe - Inclined Plane, Frictionless
Inclined Plane, Frictionless simulates the motion and forces acting on a
mass moving down a smooth, frictionless incline.
This document shows you how to use this applet in a step-by-step manner. You should have the applet open; toggle back and forth between
the ShowMe file and the applet as you work through these instructions.
Contents:
- Using the Ramp Angle Slide Control
- Introducing Free Body Diagrams
- Numerical Examples
- Running the Applet
- Getting Graphical Output
- Example: Plot a Velocity-Time Graph
- Generating Data Tables for Export to a Spreadsheet
1. Using the Ramp Angle Slide Control
- First, move the Ramp Angle slide control between 0° and 90° to observe
how the ramp and the mass (a 100 g box of crayons) move in response.
- Next, press the "Play" control button - the box of crayons should begin
to accelerate down the ramp.
2. Introducing Free Body Diagrams
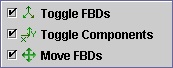
| To see a Free Body Diagram (FBD) for the box of crayons, press the
FBD control button and select all three of the check box options. You
also will see a forces information panel in the upper right corner that
shows the sizes of the various forces and components relevant to this
applet.
Try doing the following: |
 |
- Move the FBD by positioning the cursor in the centre of the FBD. A green
circle appears - you may now reposition the FBD by holding the left mouse
control button down and dragging the FBD to any position on the applet display
panel. If nothing is happening, make sure that you checked the Move FBDs
option above.
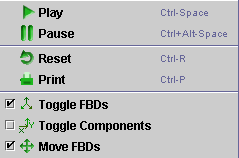
- Un-check the "Toggle Components" box by pressing
the check box. A short-cut way of doing this is to right-mouse click
anywhere in the drawing panel. The following menu will pop-up.
|
 |
3. Numerical Examples
- Adjust the ramp angle to 0°. You should see that both the normal
force and the weight (force) are 0.98 N in magnitude.
|
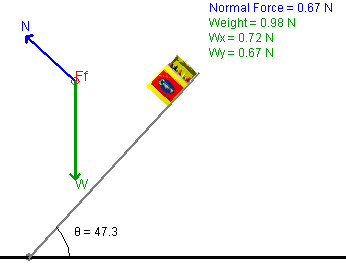 |
- Next, adjust the ramp angle to 47.3°. You should see
the normal force drop to 0.67 N, but the weight, as expected, remains
at 0.98 N. Your screen should look like the figure on the left.
- The applet shows you the magnitude of the x- and y-components of
the weight as well. You should experiment with the ramp angle to observe
how these components change with a change in the angle.
|
4. Running the Applet
To run the applet, press "Play". You will observe the mass moving. Vary the
ramp angle and note the effect that this has on the rate of acceleration of
the box down the ramp.
5. Getting Graphical Output
A very powerful feature of any applet that makes use of the grapher is the
ability to generate graphical output. To make sure that your applet will generate
graphs, ensure that data collection is enabled. Click the Data Collection
control button and make sure that "collect data" is selected. Now
press the grapher control button and follow the steps listed below.
6. Example: Plot a Velocity-Time Graph
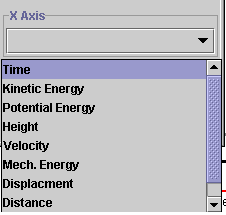
- Open the X Axis selection menu and click on Time.
|
 |
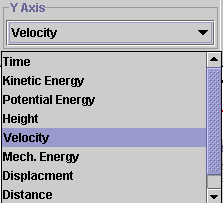
- Open the Y Axis selection menu and click on Velocity.
|
 |
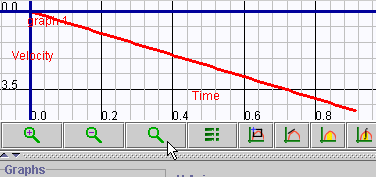
- Press the magnifying glass option to fit the v-t graph
to the screen.
|
 |
Use the Graph Tools - Slope and Area
The following two tools may be used to extract information from this graph:
| Slope - a blue "slope-arrow" will appear at the origin of the
graph. As soon as you move the cursor over the arrow it will become "active"
and you can drag it along the curve. The value of the slope will be given
in the upper-left hand corner of the grapher . |
 |
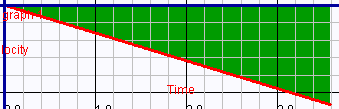
| Area - now position the cursor at the origin of the graph, hold down
the left-mouse control button, and drag the cursor along the x-axis. A green
shaded region begins to grow between the velocity graph and the x-axis.
The area of this region appears in the upper left-hand corner of the grapher. |
 |
7. Generating Data Tables for Export to a Spreadsheet
You can also export the data used to construct your graph(s) to a spreadsheet
very easily by pressing the Data Options control button and then select generate
table by pressing  from the drop-down menu.
At this point, you can either save the data as a text file or highlight it with
the mouse and cut and paste this into a spreadsheet program.
from the drop-down menu.
At this point, you can either save the data as a text file or highlight it with
the mouse and cut and paste this into a spreadsheet program.
Physics 20-30 v1.0
©2004 Alberta Learning (www.learnalberta.ca)
Last Updated: June 16, 2004