| Social Studies | Close this window |
 What's this? What's this? |
Venn Diagrams
This support material is incorporated into critical challenges at grades 6, 9, 11 and 12, however, it can be adapted for use at all grade levels.
Venn diagrams can be used to illustrate, graphically, the relationship between two or more compared objects, ideas, people or events. Venn diagrams consisting of two circles can be used to represent three kinds of relationships:
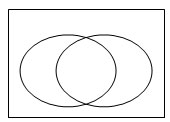
- overlapping circles suggest each item has some unique features and some common features; e.g., cars and trucks
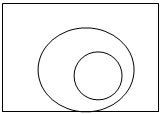
- a circle within a circle suggests that one item is a subset of a larger group; e.g., cars and modes of transportation
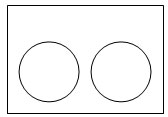
- separate circles suggest no common features between the two items; e.g., cars and people.
This graphic organizer can be used in two ways:
- Option A: Provide students with the version of the Venn diagram you wish them to work with. Ask students to list all the features they can think of in the Venn diagram. If using the overlapping circles, for example, students might list the attributes that are unique to one or the other options and those that are shared.
- Option B: To add an additional challenge, present all three diagrams and ask students to select the Venn diagram that best reflects the relationship of the items being compared. For example, which Venn diagram best reflects the relationship between sport and hobby? Is a hobby a subset of sport or vice versa? Are they overlapping concepts or unrelated?
Overlapping circles |
Circle within a circle |
Separate circles |
 |
 |
 |
Download sample |
Download sample |
Download sample |
Credits
Adapted from Critical Challenges Across the Curriculum series. Permission granted by The Critical Thinking Consortium for use by Alberta teachers.

