 Grade 7
     
|
ProbabilityStep 1: Identify Outcomes to AddressGuiding Questions
Big IdeasProbability is a measure of how likely an event is to occur. It involves predicting the likelihood of an event occurring over a period of time rather than predicting the likelihood of occurrence for a specific event for a given time. Theoretical probability of an event is the ratio of the number of outcomes in an event to the total number of possible outcomes, when all possible outcomes are equally likely. Experimental probability or relative frequency of an event is the ratio of the number of observed occurrences of the event to the total number of trials (Van de Walle and Lovin 2006, p. 334). The greater the number of trials, the closer the experimental probability approaches the theoretical probability. The sample space of a probability experiment is the set of all possible outcomes for that experiment.
Equally likely outcomes have the same probability or the same chance happening in a given probability experiment (Cathcart 1997). A single-stage probability experiment is a probability experiment that involves only one action, such as tossing one coin, to determine an outcome. A two-stage probability experiment is a probability experiment that involves two actions, such as tossing two coins, to determine an outcome. Adapted from Van de Walle, John A., LouAnn H. Lovin, Teaching Student-Centered Mathematics: Grades 5–8 (p. 341). Published by Allyn and Bacon, Boston, MA. Copyright ©2006 by Pearson Education. Adapted by permission of the publisher. Two events are independent if the fact that one event occurs does not affect the probability of the second event occurring. (http://www.mathgoodies.com/lessons/vol6/intro_probability.html)
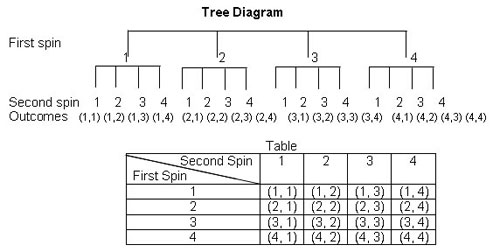
For example, the possible outcomes or sample space for one spin of the spinner shown at the left is 1, 2, 3, 4. All the outcomes are equally likely; i.e., the probability of each outcome is the same—1/4. One event from this sample space is spinning a prime number and the probability of this event is 2/4 or 1/2. Spinning the spinner twice results in two independent events because the result of the first spin does not affect the result of the second spin. The equally likely possible outcomes for two spins of the spinner can be represented in a tree diagram or table as follows.
One event of spinning the spinner twice is obtaining a sum that is a multiple of 3; i.e., (1, 2), (2, 1), (2, 4), (3, 3), (4, 2). The theoretical probability of this event is 5/16.
Adapted from Van de Walle, John A., LouAnn H. Lovin, Teaching Student-Centered Mathematics: Grades 5–8 (p. 334). Published by Allyn and Bacon, Boston, MA. Copyright ©2006 by Pearson Education. Reprinted by permission of the publisher.

|
|||||||||||||||||||||||||||||||||||||