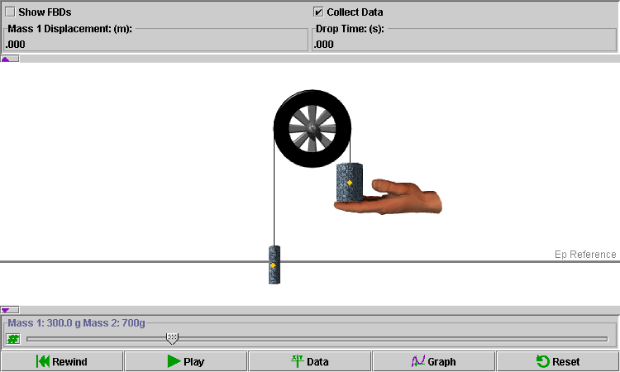
Click on a region in the image of the default applet display below to read a description of the corresponding feature:
As the larger mass attached to the Atwood's pulley falls, the smaller mass rises.
|
Centre of Mass - represented by a yellow dot. |
|
Potential Energy - As you position the cursor over the Potential Energy (Ep) Reference line, the line fades. This indicates that you have successfully 'captured' it. Holding the left-mouse button down allows you to slide the Ep Reference line up or down into the desired position. |

|
| This option allows you to view (when checked) or hide (when unchecked) free body diagrams for each of the masses attached to the Atwood's pulley. By default, this option is unchecked. In the free body diagrams, weight is represented by a green vector and tension by a black vector.
|

|
| This option allows you to activate (when checked) or deactivate (when unchecked) the Data control button (see below for more details). On a slower computer, data collection can make the animation appear 'choppy'. If you wish to improve the appearance of the animation, you can deselect this option. By default, this option is checked. |

Continuous updates on the displacement of mass 1 (in metres) and the drop time (in seconds) also are displayed here.
Clicking the minimize arrow (![]() )
will hide the data display panel. The button will switch to a maximize arrow
(
)
will hide the data display panel. The button will switch to a maximize arrow
(![]() )
- clicking this will show the data display panel once again.
)
- clicking this will show the data display panel once again.
You can adjust slider settings by either dragging the slider tab to the right (increase) or left (decrease), clicking to the right or left of the slider tab for fine adjustments, or entering an exact value in the data entry field that can be opened by clicking on the Data Entry button to the left of the slider.
 |
| Adjust Masses - This slider adjusts mass 1 between a minimum of 100.0 g and a maximum of 900.0 g in increments of 1.0 g. Since the combined mass of the system (mass 1 plus mass 2) is always equal to 1000.0 g, mass 2 changes in response to any change made to mass 1. |
The applet is controlled by the following buttons.
| Icon | Name | Description |
| |
Rewind | Run the applet again from the start without changing any settings. |
| |
Play | Allow the masses to move on the pulley. Once pressed, this button changes into a pause button. |
| |
Pause | Pause the motion. Once pressed, this button changes into a play button. |
| |
Data | Collect data as the applet is running. Data collected may include: drop time, kinetic energy of blocks 1 and 2, and potential energy of blocks 1 and 2. Data collected is saved to the clipboard and can be exported to other applications. |
| |
Graph | Open the Graph Frame, which allows you to analyze the time and energy of the masses. Use of the grapher is addressed in detail in the associated Show Me and Lesson files. |
| |
Reset | Clear all settings and start the applet over from its default state. |
Clicking the minimize arrow (![]() )
will hide the data entry and control button panels. The button will switch to
a maximize arrow (
)
will hide the data entry and control button panels. The button will switch to
a maximize arrow (![]() )
- clicking this will show the data entry and control button panels once again.
)
- clicking this will show the data entry and control button panels once again.
Physics 20-30 v1.0
©2004 Alberta Learning (www.learnalberta.ca)
Last Updated: June 16, 2004